Historical Trend Reports, new with the Winter 2014 Release, but still new to those of us too busy to explore all of the options with each release!
You can easily set up Historical Trend Reports to meet goals such as monitoring the sales pipeline or comparing historical and current values on key attributes to see how your pipeline has changed over time.
Salesforce makes three months of historical data available for you to analyze. You can select up to five date snapshots in that span to compare using up to four historical filters.
The best reports will come as you compare day-to-day or week-to-week values.
To get started, go to Setup > Customize > Reports & Dashboards > Historical Trending
Select Opportunity object and Enable Historical Trending
Select the fields you want to trend. Keep in mind that you only have 3 months of data available and up to 50 million rows of data for each object.
You can have up to 100 fields available on the reports, including the pre-selected standard fields. Number, Currency, Date and Picklist fields can be tracked over time.
You can filter the data you are tracking using the Configure Data link (ie only report on certain key stages)
After you’ve saved your changes, you will receive a message from Salesforce indicating that the data is available for reporting.
When you create your first report, you will notice that the standard Salesforce Trend reports are still available. The new Historical Trending reports can easily be found by searching on the word “trend.”
The most important thing to keep in mind is that these reports need to display in Tabular format!
Your top level options are similar to a standard report. Adjust the top level filter to Show to the appropriate records (ie “All Opportunities”), Set the Date Time Frame you need, keeping in mind that your data covers three months.
Note that you can filter on the Historical Fields or the traditional fields you’ve always had available on the object.
Set the Historical Time. This isn’t as difficult as it first seems! The default value is “Yesterday” so you can compare the change in the past day. You can select up to five dates. Initially you’ll want to try just one date so you can focus on getting the report to focus on the information that is most valuable to you.
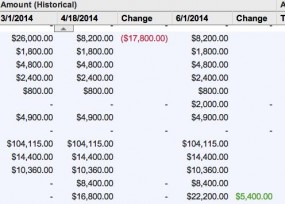
Select the Standard Field and the Historical Field you want to track (ie Amount and Historical Amount).
Mouse over the “Amount” field to reveal the pull down menu and select the option to Show Changes.
You can reverse the order if the positive number should be red and the negative number should be green. Run your report!